Designers use various methods to predict the behavior of an airplane before it has flown. Early researches concentrated on the properties of airfoils, isolated flying surfaces, and groups of surfaces, like wings and tails, in combination. Then the effects of fuselages, nacelles, struts, and so on were investigated, and the relative merits of various configurations -- biplane vs monoplane, high wing vs low, tractor vs pusher, and so on. Investigations became increasingly specific, focusing on details like slot shapes, air intakes and outlets, wingtips treatments, and so on. Results took the form less and less often of general principles and more and more of tables and graphs from which experimentally-derived trends could be inferred and applied more or less confidently to specific designs. Eventually a huge volume of experimental work had come into being, much of it created under the aegis of NACA, the National Advisory Committee for Aeronautics, which was dissolved upon the creation of NASA in 1958.
There exist compilations of experimental results intended to make it easier for designers to have the information they need at their fingertips. Sighard Hoerner's Fluid Dynamic Lift and Fluid Dynamic Drag are classics. The Air Force created its own compilation, the huge AFFDL DATCOM, which provides procedures and experimental data for every aspect of airplane and missile design.
With the advent of fast digital computers, a new approach to performance prediction began to replace the old methods. Returning to basic physics and relying on equations of fluid flow developed before the Wright brothers were born, Computational Fluid Dynamics, or CFD, predicts the behavior of a fluid as a body moves through it. CFD has several advantages over the older, empirically based approaches. For one thing, it's faster. But more important, it's completely general. The DATCOM approach is most accurate for cases similar to ones that have already been investigated; it's less dependable for novel configurations. CFD, on the other hand, plays no favorites and has no preconceptions; it simply analyzes what you give it, no matter how bizarre or unprecedented.
CFD is available in various kinds, ranging from relatively simple, fast-processing "panel codes" to more accurate, but slow and cumbersome "Navier-Stokes" methods. (Some of the Navier-Stokes people don’t even like to apply the term "CFD" to panel codes, but in fact for many purposes one serves as well as the other. Note, by the way, the important distinction between panel codes and penal codes.)
Long after the design of Melmoth 2 had been frozen, John Roncz ran some aerodynamic analyses of it using an industry-standard panel code called VSAERO. My interest piqued by these results, I started to think around 1994 of assembling a software suite that would consist of a preprocessor, based on Loftsman, for creating the digitized wireframe model for analysis; a solver, which would be NASA's public-domain Pmarc-12, a cousin of VSAERO; and a graphic postprocessor, which would display the numerical results in visually comprehensible form.
I found a partner, David Pinella, who was interested in the same project, and together we created Personal Skunk Works. No sooner had we started selling it than Lockheed sent its lawyers after us to demand that we stop using the term "skunk works," which it claimed to own, although Lockheed had, in fact, appropriated the expression from its inventor, the cartoonist Al Capp. Rather than get into a tug of war with this once great but now, in my irritable view, petty and contemptible defense profiteering organization, we changed the name of our product to the somewhat less catchy Personal Simulation Works. Call it PSW; we do.
Panel codes are so called because the surface of the airplane is divided up into a large number of quadrilateral panels whose influences on each other are calculated. The basic product of a panel code is a mapping of pressures and velocities (which are reciprocally related by a simple algebraic relation which we attribute to the eighteenth-century Swiss mathematician Bernoulli). In a "low order" panel code like Cmarc -- our adaptation, written in the C programming language, of Pmarc-12 -- pressure is constant across each panel. The raw output, with numerical values mapped as a spectrum of colors, resembles a checkerboard until the postprocessor, Postmarc, mathematically smoothes it, as in this analysis of an RV-6A:
Violet represents low pressure, green neutral, and blue high. The range of pressures corresponding to the spectrum can be selected by the user; in these images it is from -0.4 to +0.4. The basic smoothed mapping of pressure usually holds few surprises for an experienced user of CFD software, who learns after a few analyses what to expect. Other displays are also available, however. For example, the paths of streamlines along the surface of the body, or through the flow field surrounding it, can be calculated from the pressure distribution. Here are a dozen selected streamlines on the fore fuselage of Melmoth 2:
Streamlines can be analyzed individually, for example to determine the location of laminar transition, or the entire surface of the model can be covered with streamlines and the boundary layer conditions calculated for each one. The complete boundary layer of the model can then be modeled, and such parameters as boundary-layer thickness and friction coefficient can be spectrum-plotted just as pressure coefficient was. The friction coefficient can be integrated over the surface to obtain the friction drag.
Knowledge of streamline paths and of the variation of local pressure with angle of attack can be useful for detail design decisions. For example, I found a good location for static pressure ports by investigating the variation of Cp (pressure coefficient) all over the fuselage at a range of angles of attack from zero to 12, and finding the spot where the Cp showed the least deviation from zero. I also was able to find a location for cabin air inlets that would be uncontaminated by engine cooling air, and to orient a small streamlined vent under the cowling to coincide with the local flow direction.
Knowing pressures over the complete airplane means knowing flight loads; and knowing how pressures vary with angle of attack means knowing stability derivatives. Digital Wind Tunnel, an optional component of PSW, calculates static and dynamic stability, elevator setting for trim, neutral point, and roll rate by repeatedly analyzing the model at various angles of attack and yaw and over a range of control-surface deflections.
While information about stability, streamline paths, and flight loads is directly useful to a designer, much CFD output is valuable to students for its ability to vividly illustrate aerodynamic phenomena. For instance, the interaction of the wings of a biplane, the upper wing diminishing the lift of the lower, is clearly visible in these maps of pressure and circulation in the air surrounding the wings of a Sopwith Camel:
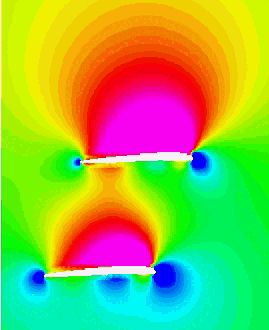
Note that the upper and lower wings have the same chord, airfoil, and incidence; but the low pressure generated by the lower wing is partly canceled by high pressure below the upper one. The circulation map below consists of local velocity vectors from which the free stream velocity has been subtracted; the swirling pattern represents the incremental velocities imparted to the air by the passage of the wings.